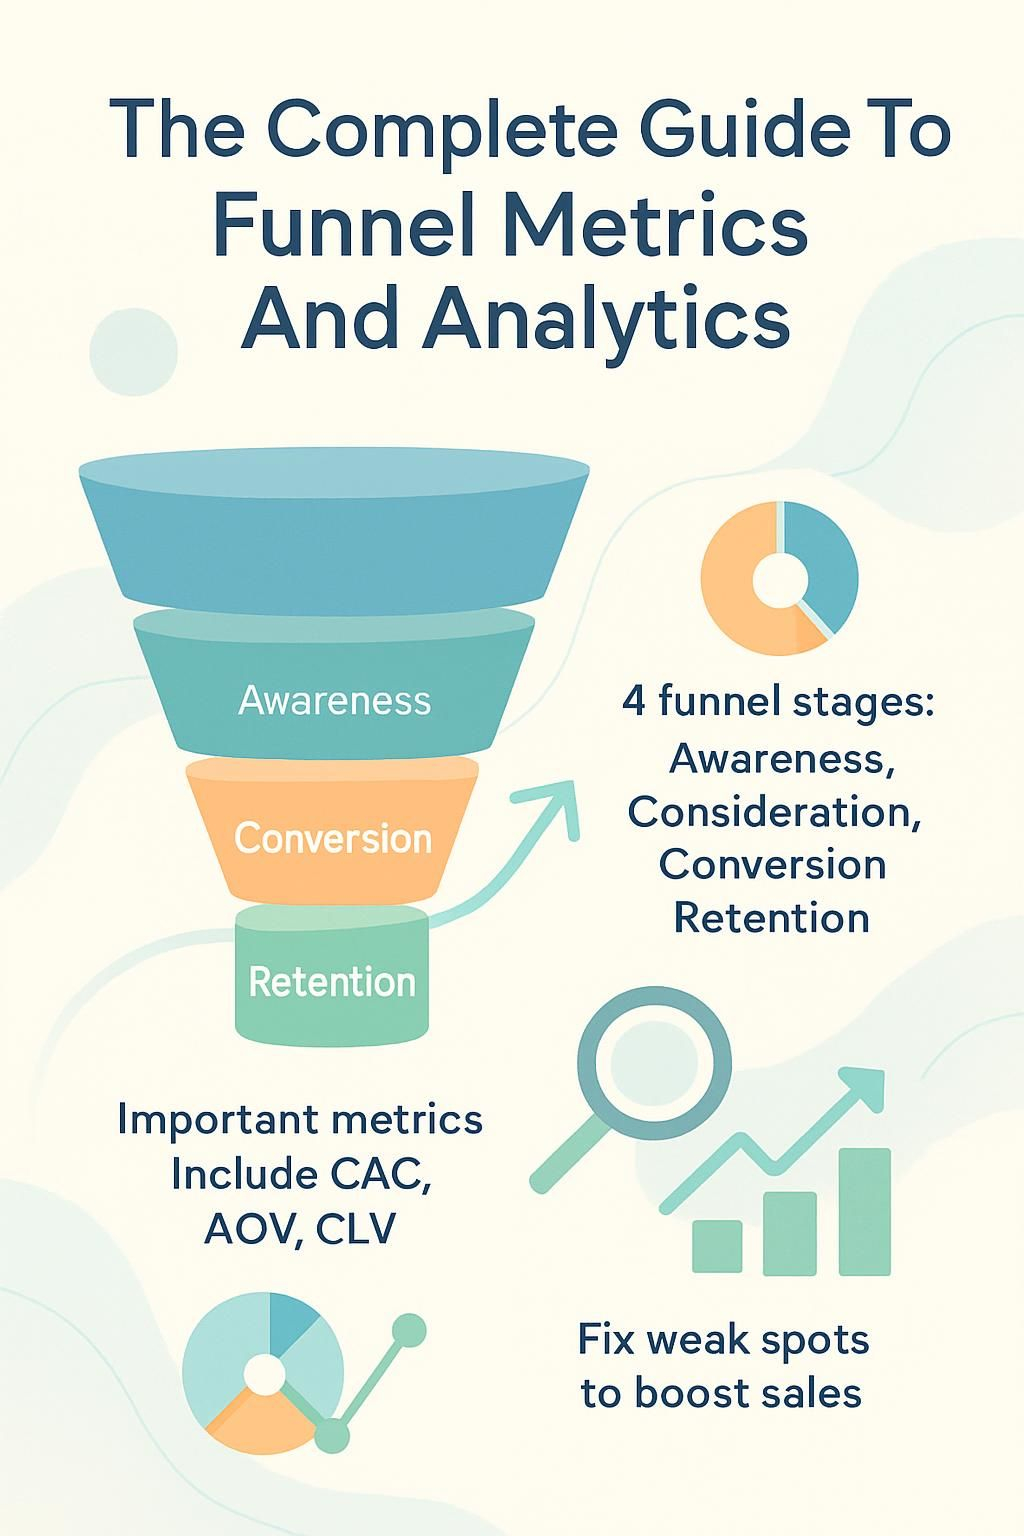
The Complete Guide To Funnel Metrics And Analytics
You want your marketing funnel to work, but you keep losing people along the way. Many businesses miss out on sales because they don’t track key funnel metrics like conversion rate or customer acquisition cost (CAC).
This guide gives you simple steps and tools, from Google Analytics to real-time dashboards, to help boost total sales and improve every stage of the customer journey. Ready to fix those drop-offs? Keep reading to learn how funnel analysis can change your results.
What Are Funnel Metrics and Analytics?

Funnel metrics and analytics help you track how people move through your marketing funnel. Each stage in the customer journey, like awareness or conversion, gets measured with numbers such as impressions, engagement rates, bounce rate, or conversion rate.
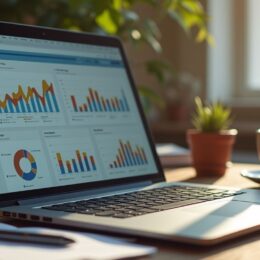
Tools like Google Analytics and Mixpanel show where visitors stay active or drop off on your landing pages.
“Small changes make a big impact in each step of the sales funnel.”
Set up key performance indicators (KPIs) for every part of your user journey. Check drop-off points to find spots that need improvement. Use both numbers and real-time insights from heatmaps to watch how users interact with content marketing pieces or call-to-action buttons.
Focus on important stats—conversion rates for salespeople, retention rates for brand loyalty programs—and use data analytics to improve ROI and profit margins across all channels.
Key Stages of a Funnel
A marketing funnel has several key steps, and each step shapes how your customers move from first hearing about you to buying—and even coming back. Understanding this journey helps you spot where people lose interest and what may boost your total sales or lead generation.
Awareness Stage (Top of Funnel – TOFU)
The Awareness Stage is the first part of the customer journey. Here, users discover your brand for the first time. They see your ads, social media posts, or blog articles. This stage is essential for building brand awareness and reaching your target audience.
It helps users connect with your products.
In this phase, key metrics include impressions and reach. These numbers show how many people saw your content. Tracking bounce rates indicates if visitors stay on your site or leave quickly.
Understanding traffic sources helps you know where users found you. Analyzing these funnel metrics can enhance user experience and increase business success.
Consideration Stage (Middle of Funnel – MOFU)
After users recognize your brand, they transition to the consideration stage. Here, potential customers learn about and evaluate your products or services. This is a crucial time for you to connect with them.
During this stage, concentrate on increasing engagement rates. You want visitors to explore your website more and sign up for emails. By doing so, you can turn interested users into leads who will engage further with your brand.
Tracking metrics like lead generation rates helps enhance user experiences and target campaigns effectively as you aim for higher conversion rates in the sales funnel.
Conversion Stage (Bottom of Funnel – BOFU)
The Conversion Stage is where users take action. This may mean making a purchase or signing up for a service. In this stage, your goal is to boost conversion rates. You want as many visitors as possible to become customers.
Tracking key metrics helps you here. Look at customer acquisition cost (CAC) and average order value (AOV). These numbers tell you how well your marketing strategy works. By addressing drop-off points, you can keep more users engaged.
Funnel analysis allows you to understand user behavior better and make improvements in real time.
Retention and Loyalty Stage (Post-Purchase)
After the Conversion Stage, you focus on keeping customers. This is where the Retention and Loyalty Stage begins. Your goal is to keep customers engaged after their purchase. You want them to return again and again.
Key metrics help you track success in this stage. These include customer retention rate, churn rate, and customer lifetime value (CLV). Analyzing these numbers shows you where customers drop off.
By understanding user behavior during this time, you can improve their experiences. Happy customers are likely to stay loyal to your brand and tell others about it too! Use tools like Google Analytics for real-time insights into your customers’ actions.
Important Funnel Metrics to Track
Tracking key funnel metrics is essential for understanding how customers move through your sales funnel. Metrics like conversion rates and customer acquisition costs give you real-time insights into what’s working and what needs change…
Keep an eye on these metrics to boost your marketing strategy!
Conversion Rates
Conversion rates show how many people take the action you want. This could be buying a product or signing up for a newsletter. A high conversion rate means more success in your marketing funnel.
To improve this, track important metrics like customer acquisition cost (CAC) and average order value (AOV). When you know these numbers, you can better understand what works.
Funnel analysis helps spot where people drop off during their journey. Addressing these drop-off points first has the biggest impact on improving conversions. You can use tools like Google Analytics or Mixpanel to get real-time insights into user behavior.
Focus on making changes that encourage users to act, like clear calls to action (CTA).
Abandonment Rates
Abandonment rates show how many people leave your sales funnel without completing a purchase. This often happens during the checkout process. You might notice that customers add items to their cart but leave before paying.
This is important because it affects your conversion rate.
Tracking abandonment rates helps you find problems in your customer journey. If high, you may need to simplify your checkout page or improve user engagement with clear calls to action (CTA).
Understanding why users drop off can boost your total sales and improve customer experience (CX). Now, let’s look at essential funnel metrics to track.
Customer Acquisition Cost (CAC)
Customer Acquisition Cost (CAC) helps you understand the cost of gaining new customers. It shows how effective your marketing efforts are during the conversion stage of the customer journey.
You can calculate CAC by dividing your total marketing costs by the number of new customers gained in a period.
Tracking CAC trends is key for improving user experiences and boosting business outcomes. It can also help spot drop-off points in your sales funnel metrics. If CAC is high, you might want to test different messages or page designs to improve click-through rates and conversion rates.
Average Order Value (AOV)
Average Order Value (AOV) measures how much money you make from each order. It is a key metric in the conversion stage of the customer journey. AOV lets you see how well your pricing and promotions work together to boost revenue.
For example, if your store sells high-ticket items, a higher AOV can mean more profit for every sale.
Tracking AOV helps improve marketing efficiency. Pair it with Customer Acquisition Cost (CAC) to evaluate your spending on acquiring new customers. If you know your AOV trends, you can create better upselling strategies and targeted promotions.
This way, you guide customers toward spending more during their visits while maximizing total sales over time.
Customer Lifetime Value (CLV)
Next, let’s look at Customer Lifetime Value (CLV). CLV is a key measure in the retention stage of the customer journey. It indicates how much money a customer will bring to your business over time.
Knowing your CLV helps you determine how much you can spend on finding new customers or managing costs.
This metric also aids in understanding Customer Acquisition Cost (CAC) and overall profitability. By tracking both, you gain insights into what keeps customers coming back. You want to lower churn rates and boost retention rates, which affect CLV directly.
Analyzing this value alongside other funnel metrics can help refine your marketing strategy and improve user experiences effectively.
Tools for Funnel Analytics
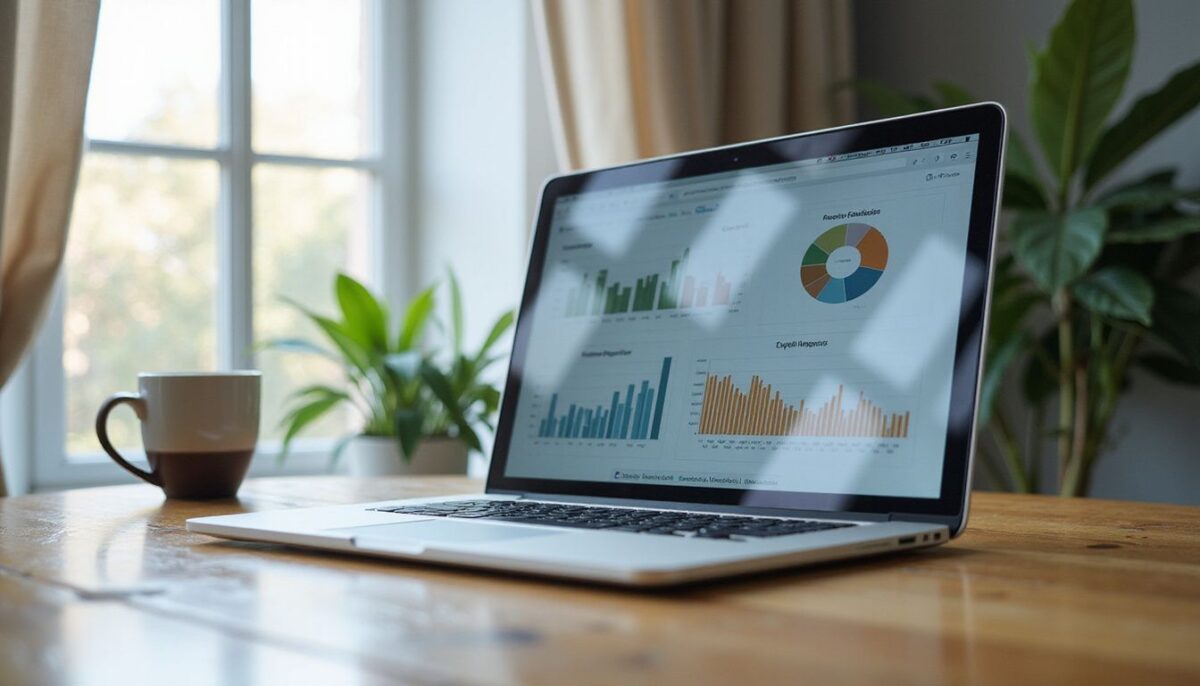
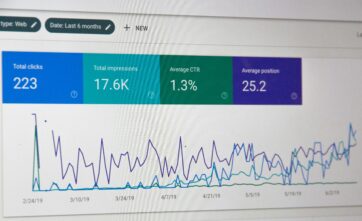
You need the right tools for funnel analytics. They help you see how users move through your sales funnel. Google Analytics offers insights on website traffic and user behavior. Mixpanel tracks events to show how customers engage with products.
Amplitude helps spot trends over time to boost conversion rates. Heatmaps reveal where users click most on your site, showing what grabs their attention! Each tool gives unique data to improve your marketing strategy.
Google Analytics
Google Analytics is a key tool for tracking your users’ progress through the customer journey. It helps you understand four important stages: Awareness, Consideration, Conversion, and Retention.
By using this tool, you can see how many people visit your site and how they interact with it. Important metrics include impressions and engagement rate.
Funnel analysis in Google Analytics starts by defining each stage clearly. Set up tracking to follow user behavior closely. This allows you to find drop-off points where users leave the funnel without converting.
Focus on those significant moments first; they can provide real-time insights into what needs improvement. Advanced analytics tools can further boost Google Analytics by giving deeper insights into user behavior and motivations.
Mixpanel
Moving from Google Analytics, let’s discuss Mixpanel. This tool is great for tracking user progress in funnel stages. It helps you understand the customer journey better. You can define different stages of the funnel clearly.
Mixpanel measures important metrics at each stage. During the awareness stage, it tracks impressions and reach to see how many people know about your brand. In the consideration stage, it focuses on engagement metrics like website visits.
As users move to conversion, Mixpanel monitors conversion rates closely. Finally, this tool also looks at retention metrics after purchase—like customer lifetime value and churn rate—to keep customers coming back long-term.
Amplitude
After Mixpanel, let’s talk about Amplitude. It is an important tool for tracking how users move through the marketing funnel. Amplitude helps you see where customers drop off in their journey.
This way, you can fix issues and improve your conversion rates.
With advanced analytics, Amplitude shows user behavior and motivations clearly. You can better understand what keeps customers engaged or causes them to leave. This insight is key for optimizing your sales process and boosting customer acquisition.
Heatmaps and Session Recordings
Heatmaps show how users interact with your website. They reveal where people click, scroll, and spend time on a page. This visual data helps you understand user behavior. You can see which areas grab attention and which do not.
Session recordings give a closer look at individual user journeys. They track how each person navigates your site. By watching these sessions, you can spot drop-off points in the funnel.
These tools provide real-time insights into customer actions, guiding you to improve design and user experience.
Best Practices for Optimizing Funnel Performance
To boost your funnel performance, find where users drop off and fix those spots; track your key metrics like conversion rates and customer behavior, then test different calls to action.
Want to learn more about improving your sales process? Keep reading!
Identify and Address Drop-Off Points
Identifying drop-off points in the customer journey is key to improving your funnel. Start by mapping out the stages: Awareness, Consideration, Conversion, and Retention. Use analytics tools like Google Analytics or Mixpanel to find where many users leave your site.
Look for patterns in data that show high abandonment rates.
Once you locate these drop-off points, address them quickly. Test different calls to action (CTAs) and improve messaging for better engagement. Real-time insights can help understand user behavior when they decide not to move forward.
Qualitative methods, like user interviews, give a deeper look at why customers might hesitate or abandon their journey altogether. Focus on small changes first; even little tweaks can lead to significant improvements in conversion rates down the line.
Test and Refine Messaging and Design
Testing different messages and designs is key to improving your funnel. A/B testing helps you find out what works best for your audience. By changing words or layouts, you can see how users react.
This feedback is important for refining your messaging.
Good design keeps users engaged and coming back. If a user sees something they like, they are more likely to stay longer. Make sure the call to action stands out. Tracking metrics like conversion rates and bounce rates will help you understand where changes are needed.
Keep experimenting to meet user needs better!
Monitor Leading and Lagging Indicators
Monitoring leading and lagging indicators is key to understanding funnel performance. Leading indicators give you early hints about future user behavior. For instance, if you see more people clicking on your ads, they may move closer to buying.
Lagging indicators show what has already happened. If your conversion rate drops after a big marketing campaign, this tells you it’s time to analyze the results.
Tracking both types of indicators helps improve the customer journey. By spotting drop-off points in your sales funnel, you can focus efforts where they matter most. Tools like Google Analytics can assist with this analysis and provide real-time insights into user actions.
Understanding these metrics directly leads to better optimization strategies for your marketing funnels and improves conversion rates.
Next up is how to identify and fix those drop-off points effectively!
Conclusion
Funnel metrics and analytics are key to your business success. They help you understand your customers better. You can track different stages, from awareness to loyalty. Use tools like Google Analytics or Mixpanel for insights.
Focus on improving each part of the customer journey for better results.